The rise of collaborative Music
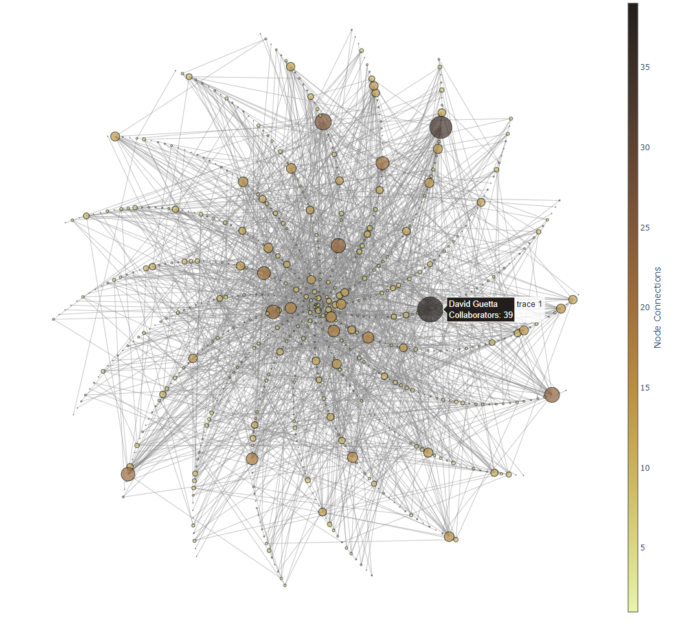
I use data from top 10 thousand most streamed tracks on Spotify from 1960s onwards to show (1) an increasing trend of collaboration in the music industry, and present (2) an interactive network of (i) all artists, and what I call (ii) serial collaborators i.e., artists who frequently collaborate so much so that they form a large connected component in the graph. Find your favorite in there!
→ Click here to access the original post ←
Mapping Violent Events using Python
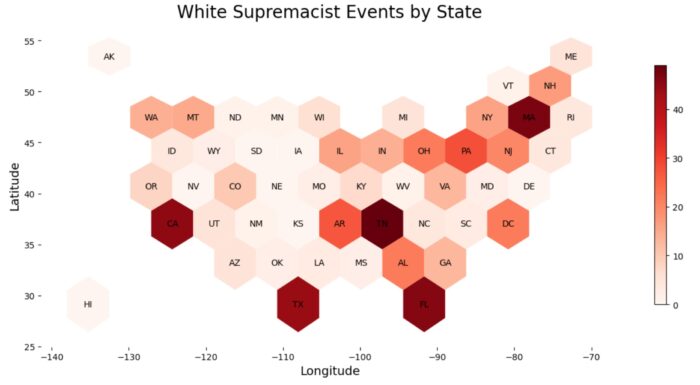
This tutorial takes raw data from Anti-Defamation League (ADL)’s H.E.A.T. (Hate, Extremism, Antisemitism, Terrorism) database, which contains various incidents of hate, extremism, antisemitism and terrorism. These incidents are geo-coded to locality level. What we will do is (i) filter a subset of incidents from the database, (ii) convert localities into coordinates (longitude, latitude), (iii) map them using various techniques, and (iv) produce a heatmap, and (v) a couple of static maps.
— Click here to access the tutorial on GitHub! —
The Tragic Arcs of Turkish Soap Operas

My hypothesis is that we can say a lot about a culture by analyzing its popular tales. These tales reflect the dominant views of about life and its twists and turns. Some cultures have a brighter view while others dim. This collective zeitgeist is reflected in popular culture.
We (I, Selcan Mutgan, Guanghui Pan, Abbas K. Rizi) tested it recently using data from Turkey. We analyzed the narrative arcs of 217 Turkish Soap Operas plots (stay tuned for a separate post on my other project using plots of 30,000+ movies). We found that the dominant narrative arc in Turkish Soap Operas is ‘tragic’ where things start all flowery but then everything goes down the toilet as the plot proceeds. May be a reflection of how the Turkish audience expects the life to be?
→ Click here to access the original post ←
The Cultural Geography of the UFOs
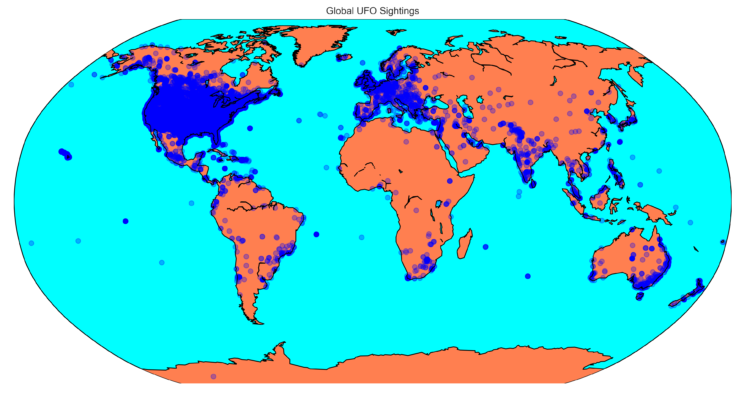
I use data of 80 thousand UFO sightings across the globe to tell how cultural geography affects our collective psyche.
→ Click here to access the original post ←
Contextualizing Deaths in Israeli–Palestinian Conflict
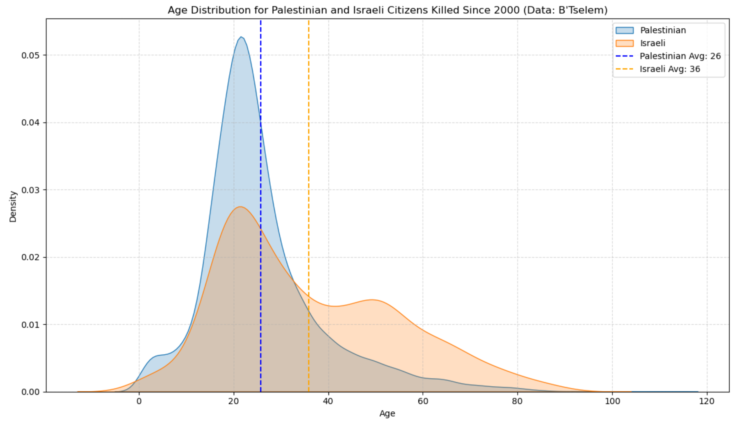
Contextualization is neither a justification for violence nor it is an apology on the behalf of Hamas. Yet, contextualization affords us a bird’s-eye view of the circumstances in which violence arose – for violence never occurs in vacuum (and when it does, it should not be justified). Contextualization also allow us to recognize the humanity of ‘the other’, allow us to collectively grieve the loved ones we lost and the ones they lost. Contextualization allows us to empathize; to search for the root-cause, to look for symptoms, to seek remedies, to heal, to live and let live, and to break the cycle of violence!
→ Click here to access the original post ←